Irrigation Setup
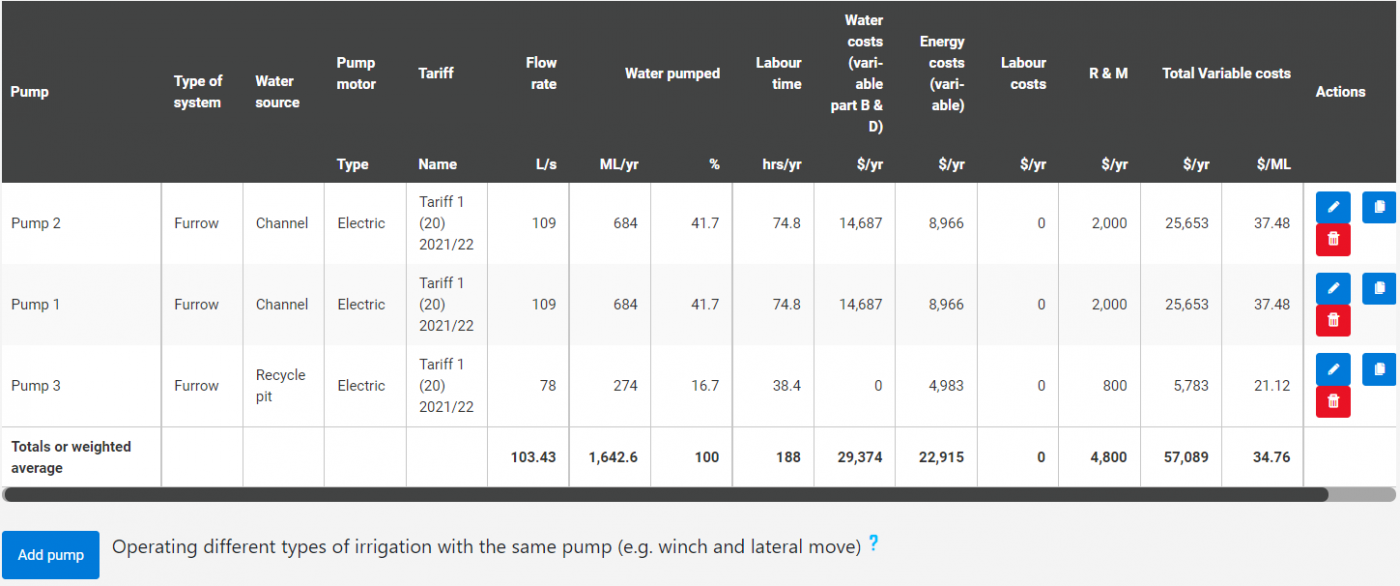
This page is used to add irrigation pumps and associated information. There will be a number displayed at the top of the page to indicate how much water is applied per year across the whole farm. This figure is from the Cane Growing Costs and Other Crops Growing Costs pages.
Adding a Pump
To add a pump to the scenario, click “add pump”. Pumps can also be added on the Cane Growing Costs and Other Crops Growing Costs.
- If operating different types of irrigation with the same pump (e.g. winch & lateral move), please add the same pump multiple times then enter the system types and either (1) enter the fixed water (Part A & C) and electricity (supply & kW charges) costs for just one system or (2) apportion the fixed costs appropriately (e.g. 40% winch, 60% lateral move).
Pump Details
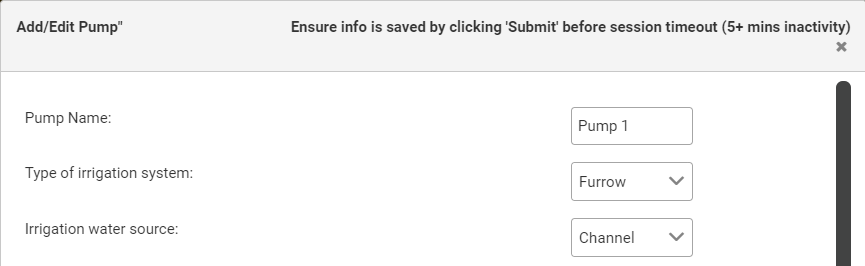
1. Give the pump a name. For example “Pump 1”.
2. Choose the type of irrigation system that the pump is.
3. If known, enter the average pump flow rate in Litres per second (L/sec) OR click “Calculate” to calculate the figure.
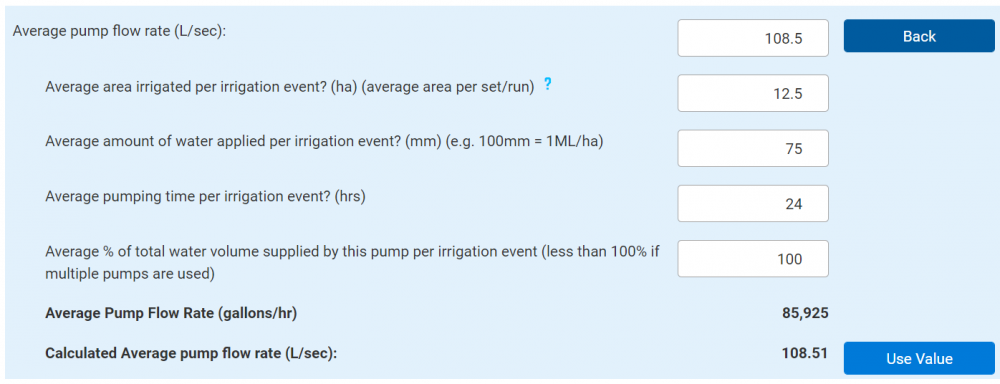
Average Pump Flow Rate
Calculate the average pump flow rate with the following steps:
1. Enter the average area irrigated per irrigation event in hectares (ha).
- This is the average area per set/run.
- Area (ha) = row width (m) x number of rows x length or run (m) / 10,000 (e.g. 1.6m x 50 rows x 500m / 10,000) = 4 ha.
- Area irrigated outside the cropping area should be included.
2. Enter the average amount of water applied per irrigation event in millilitres (mm). For example, 100mm = 1ML/ha.
3. Enter the average pumping time per irrigation event in hours (hrs).
4. Enter the average percentage of total water volume supplied by this pump per irrigation event.
- This would be smaller than 100% if there are multiple pumps used.
5. The value for average pump flow rate in gallons per hour (gallons/hr) should be displayed for your information.
6. Click “Use Value” to enter the number calculated for average pump flow rate (L/sec).
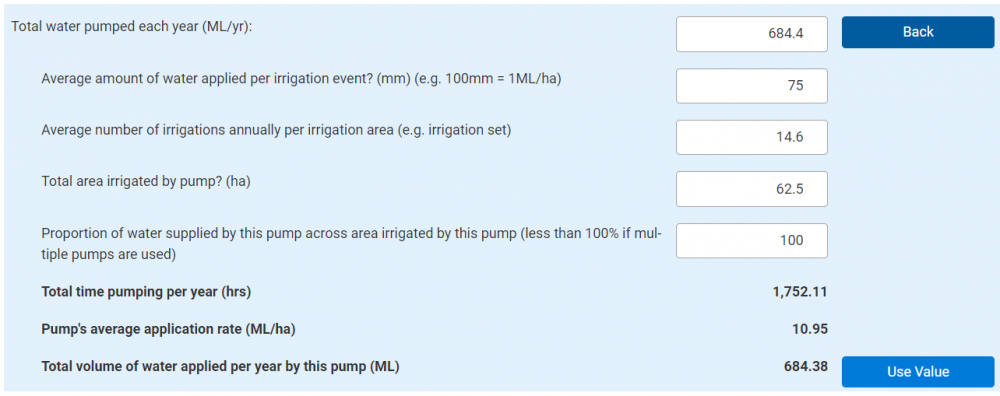
Total Water Pumped
If known, enter the total water pumped each year in Megalitres per year (ML/yr) OR click “Calculate” to calculate the figure.
Calculate the total water pumped each year with the following steps:
1. If you have not already, enter the average amount of water applied per irrigation event in millilitres (mm). For example, 100mm = 1ML/ha.
2. Enter the Average number of irrigations annually per irrigation area. For example, the number of irrigation sets.
3. Enter the total area irrigated by the pump in hectares (ha).
4. Enter the proportion of water supplied by this pump across area irrigated by this pump.
- This would be smaller than 100% if multiple pumps are used.
5. The numbers for total time pumping per year in hours (hrs) and the pump’s average application rate in Megalitres per hectare (ML/ha) should be displayed for your information.
6. Click “Use Value” to enter the number calculated for total volume of water applied per year by this pump in Megalitres (ML).
Water Costs Per Year
If known, enter the variable water costs in dollars per year ($/yr) OR click “Calculate” to calculate the figure.
Calculate the water costs per year with the following steps:
1. Enter the variable water charges in dollars per Megalitre ($/ML). For example Sunwater "Part B and D" charges, Lower Burdekin Water "open water" charge, or temporary transfer costs.
2. Enter the other variable water costs in dollars per year ($/yr). For example brokerage fees.
3. Click “Use Value” to enter the number calculated for total variable water charges per year ($/yr).

Energy Costs Per Year
If known, enter the variable energy costs per year ($/yr) OR click “Calculate” to calculate the figure.
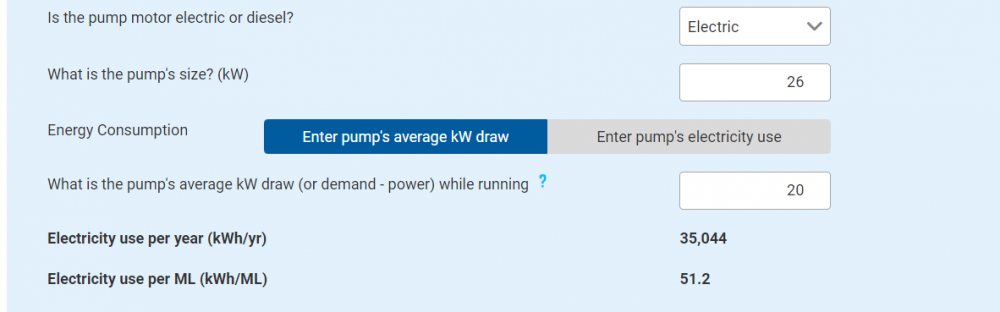
1. Choose if the pump motor is electric, diesel, or no pump.

Electric Pump
1. IF the pump is electric, follow the below steps. IF the pump is not electric please skip to the Diesel Pump section:
2. Enter the pump size in kilowatts (kW).
Energy Consumption
If the pump energy consumption is calculated by the pump’s average kilowatt (kW) draw then:
1. Enter the pump’s average kW draw (or demand – power) while running.
- A pump's kW draw (or drawdown) can be calculated by dividing the kWh used (by the pump) by the number of hours spent pumping.
- For example, 240 kWh / 12 hrs = 20 kW.
- Given that pump kW draw can vary, it is important to take a number of measurements over the year to ensure accuracy.
2. The electricity use per year (kWh/yr) and the electricity use per Megalitre (kWh/ML) should now be displayed for your information.
If the pump energy consumption is calculated by the pump’s electricity use then:
1. Enter the pump’s average annual electricity use in kilowatt hours per year (kWh/yr).
2. If not already entered, enter the average water pumped in Megalitres per year (ML/yr).
3. If not already entered, enter the average pump flow rate in Litres per second (L/s).
4. The electricity use per Megalitre (kWh/ML) and the pump’s average kilowatt draw (kW) should now be displayed for your information.
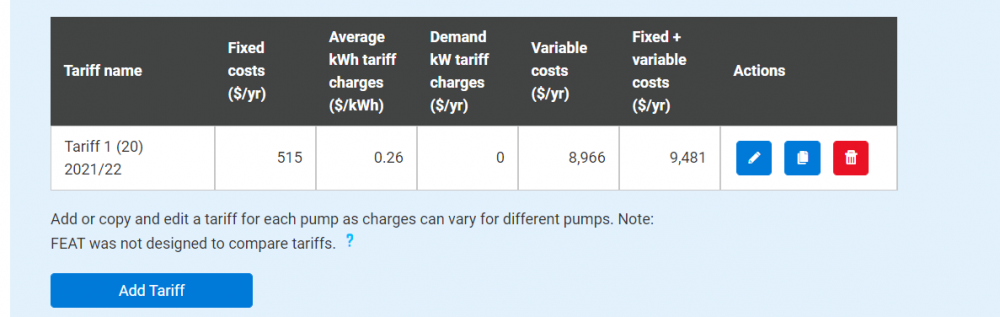
Adding a Tariff
1. Click “Add Tariff” to add a tariff for the pump.
- Please note that you can add or copy and edit a tariff for each pump as charges can vary for different pumps. Once you have added multiple tariffs, make sure you have the correct tariff for the correct pump selected in the drop down box.
- Please also note that you must save your info by clicking submit before the session times out after 5 minutes of inactivity.
- FEAT was not designed to compare tariffs but rather cost your existing tariffs where sufficient information is available. Costing new or unused tariffs using uncertain information is likely to result in inaccurate estimates of electricity costs (e.g. ratios of peak and off-peak utilisation, exceedance of demand thresholds). Farming system considerations may also be relevant to tariff decisions (production impacts, times of use). Seek professional advice before making changes.
2. Enter the tariff name.
3. If known, enter the fixed electricity charges per year ($/yr). For example, daily supply charge.
4. OR click “Calculate” to calculate the figure.
Supply Charges
1. Enter the daily supply charge in dollars per day ($/day).
2. The annual daily supply charge cost in dollars per year ($/year) should now be displayed for your information.
3. Choose either “Yes” or “No” by clicking one to answer if there are any additional fixed charges. For example, tariff 66 has these.
4. IF “No”, click “Use Value” to use the calculated value.
5. IF “Yes”, enter the additional pump size charge in dollars per pump meter per year ($/pump meter/yr). For example lower charge $/kw x first 7.5 kWs + higher charge $/kW x remaining kWs.
6. Now enter the other fixed electricity charges in dollars per pump meter per year ($/pump meter/yr).
7. Click “Use Value” to use the calculated value.

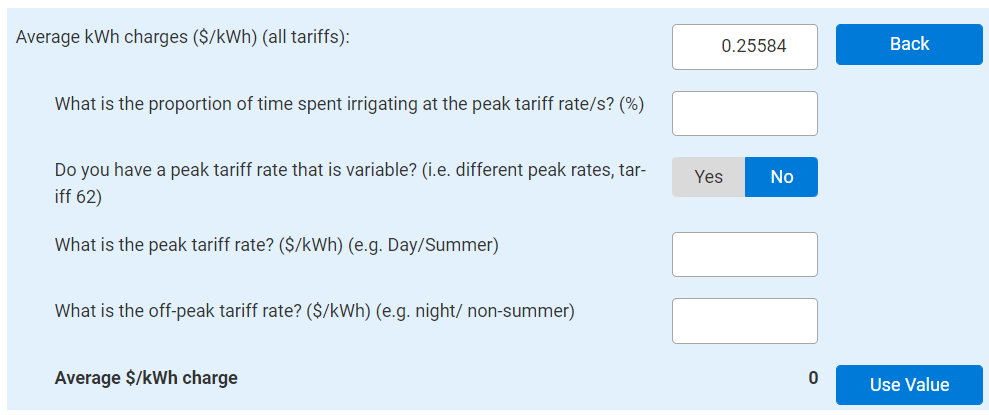
Average kWh Charges
1. If known, enter the average kWh charges in dollars per kilowatt hours ($/kWh) for all tariffs OR click “Calculate” to calculate the figure.
2. Enter the proportion of time spent irrigating at the peak tariff rate or rates as a percentage (%).
3. Choose either “Yes” or “No” by clicking one to answer if the peak tariff rate is variable or not. For example, different peak rates like tariff 62.
IF “No”, Enter the peak tariff rate in dollars per kilowatt hours ($/kWh). For example day or summer.
1. Then enter the off-peak tariff rate in dollars per kilowatt hours ($/kWh). For example night or non-summer.
2. The average $/kWh charge should now be displayed for your information and click “Use Value” to use the figure.
IF “Yes”, enter higher peak tariff rate in dollars per kilowatt hour ($/kWh). For example, for the first 10,000 kWh per month.
1. Then enter the lower peak tariff rate in dollars per kilowatt hour ($/kWh). For example, above 10,000 kWh per month.
2. Then enter the proportion of peak tariff time spent irrigating at the higher peak tariff rate as a percentage (%).
3. Then enter the off-peak tariff rate in dollars per kilowatt hours ($/kWh).
4. Now the average $/kWh charge should be displayed for your information and click “Use Value” to use the figure.
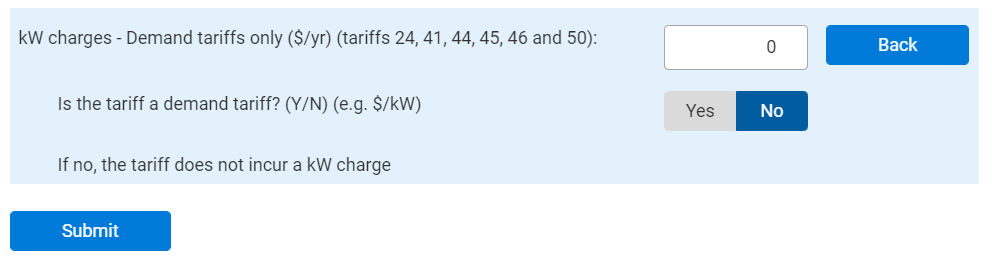
Demand Tariff Charges
1. If known, enter the kW charges for demand tariffs only in dollars per year ($/yr). This is only for tariffs 24,41,44,45,46 and 50.
OR click “Calculate” to calculate the figure for kW charges.
2. Choose either “Yes” or “No” by clicking one to answer if the tariff is a demand tariff or not.
IF “No”, there are no kW charges for non-demand tariffs and enter “0” for kW charges and then click “Submit”.
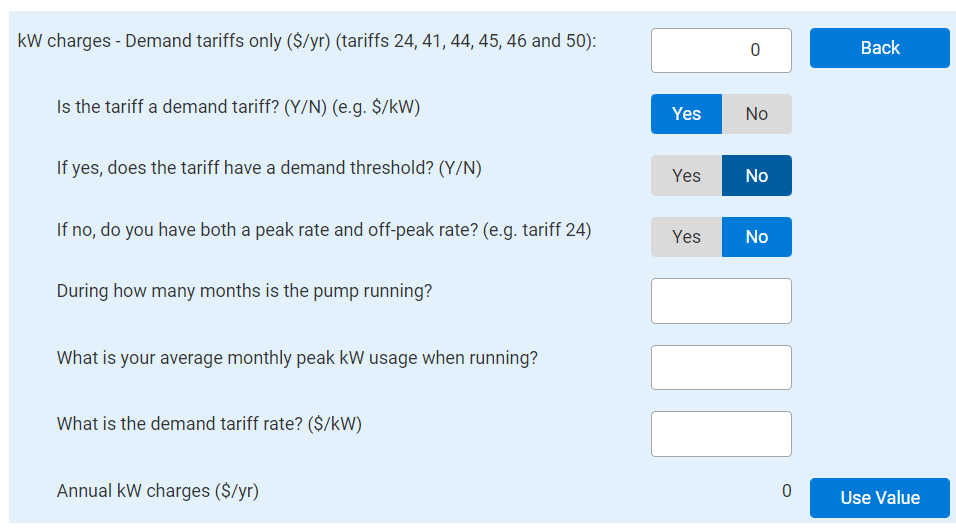
Demand Tariff without Peak and Off-Peak
IF there is is not a demand threshold and the tariff does not have both a peak and off-peak rate then follow the steps below:
1. Enter during how many months is the pump running.
2. Enter the average monthly peak kilowatt usage when running (kW).
3. Enter the demand tariff rate in dollars per kilowatt ($/kW).
4. The annual kW charges ($/yr) will be displayed for your information and click “Use Value” to use the calculated value.
Demand Tariff with Peak and Off-Peak
IF there is not a demand threshold but the tariff has both a peak and off-peak rate then follow the steps below:
1. Enter how many months the pump is pumping above the first threshold. For example, in summer.
2. Enter how many months have a peak demand rate charge.
3. Enter what the average peak demand kilowatt usage is for these months (kW).
4. Enter what the demand peak tariff rate is in dollars per kilowatt ($/kW). For example, day and summer peaks.
5. Enter how many months have an off-peak demand rate charge.
6. Enter what is the average off-peak demand kilowatt usage for these months (kW).
- Please note that there is a minimum of 3kW over 9 months for Tariff 24.
7. Enter the off-peak demand tariff rate in dollars per kilowatt ($/kW). For example, night or non-summer.
8. The annual kW charges ($/yr) will be displayed for your information and click “Use Value” to use the calculated value.

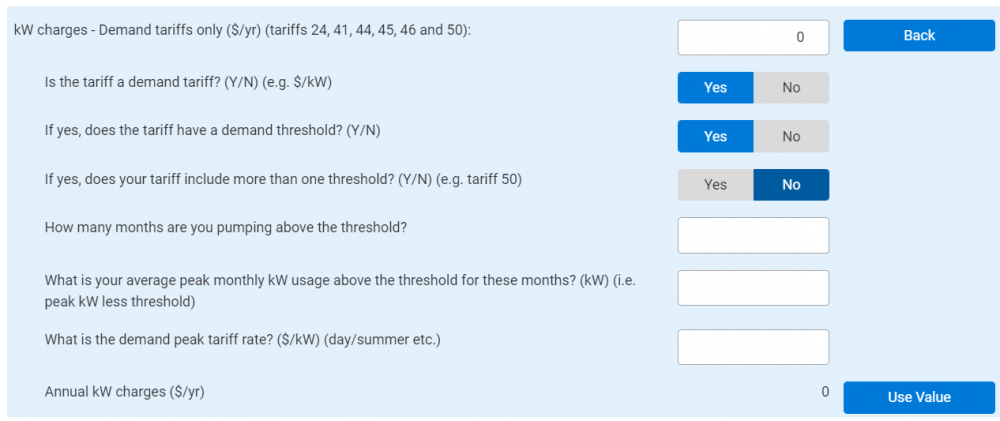
Demand Tariff with Single Threshold
IF there is a demand threshold but the tariff does not include more than one threshold then follow the steps below:
1. Enter how many months the pump is pumping above the threshold.
2. Enter what the average peak monthly kW usage above the first threshold for these months is in kilowatts (kW). For example, peak kW less threshold.
3. Enter what the demand peak tariff rate is in dollars per kilowatt ($/kW). For example, day and summer peaks.
4. The annual kW charges ($/yr) will be displayed for your information and click “Use Value” to use the calculated value.
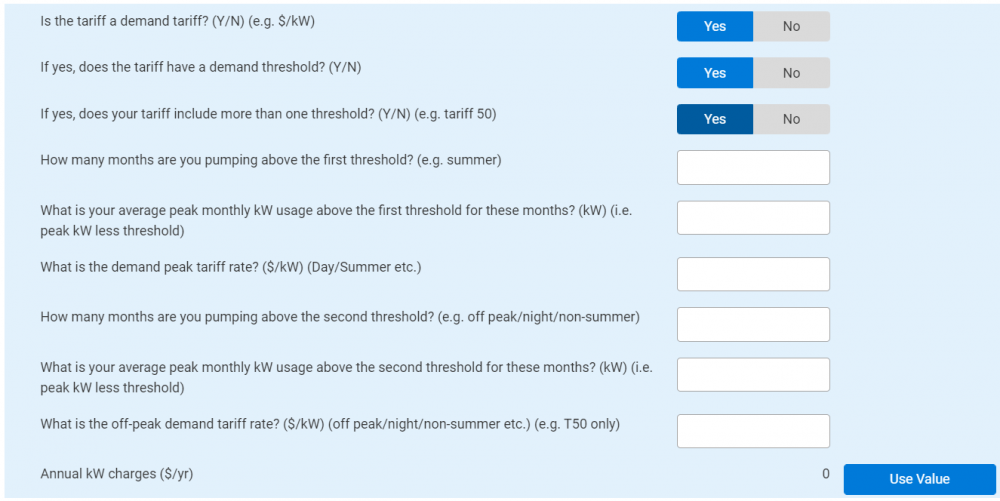
Demand Tariff with Multiple Thresholds
IF there is a demand threshold and the tariff also includes more than one threshold then follow the steps below:
1. Enter how many months the pump is pumping above the first threshold. For example, in summer.
2. Enter what the average peak monthly kW usage above the first threshold for these months is in kilowatts (kW). For example, peak kW less threshold.
3. Enter what the demand peak tariff rate is in dollars per kilowatt ($/kW). For example, day and summer peaks.
4. Enter how many months the pump is pumping above the second threshold. For example, off peak, night or non-summer.
5. Enter what is the average peak monthly kilowatt usage above the second threshold for these months (kilowatt). For example, peak kW less threshold.
6. Enter what the off-peak demand tariff rate is in dollars per kilowatt ($/kW). For example, off-peak, non-summer and T50 only.
7. The annual kW charges ($/yr) will be displayed for your information and click “Use Value” to use the calculated value.
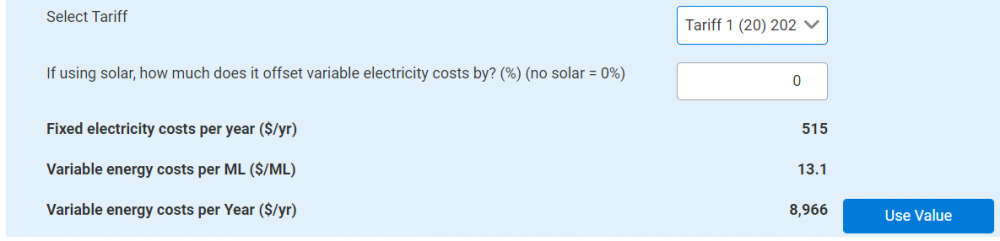
Submitting Tariff and Calculated Value
1. Then click "Submit” to add tariff.
2. Select the correct tariff from the drop down box.
3. Enter the amount that, if using solar, it offsets the variable electricity costs by as a percentage (%). For example, if there is no solar “0%” would be entered.
4. The fixed electricity costs per year ($/yr) and the variable energy costs per ML ($/ML) will be displayed for your information.
5. The variable energy costs per year ($/yr) value can now be used by selecting “Use Value”.
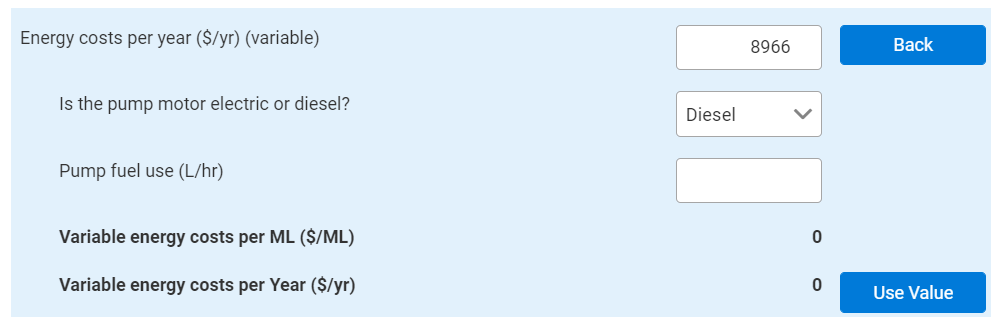
Diesel Pump
1. IF the pump is diesel, follow the steps below. IF there is no pump, skip to the No Pump section.
2. Enter the pump fuel use in Litres per hour (L/hr).
3. The variable energy costs per Megalitre ($/ML) should now be displayed for your information.
4. Click "use value" to enter the number calculated for variable energy costs per year ($/yr).
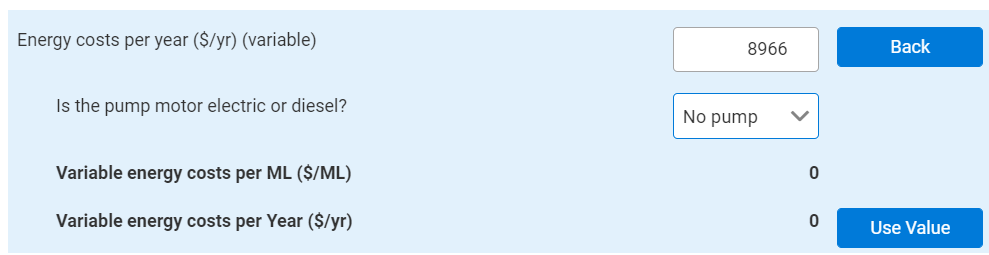
No Pump
IF there is no pump, follow the below steps:
1. Click “use value” to enter the zero calculated for variable energy costs per year ($/yr).
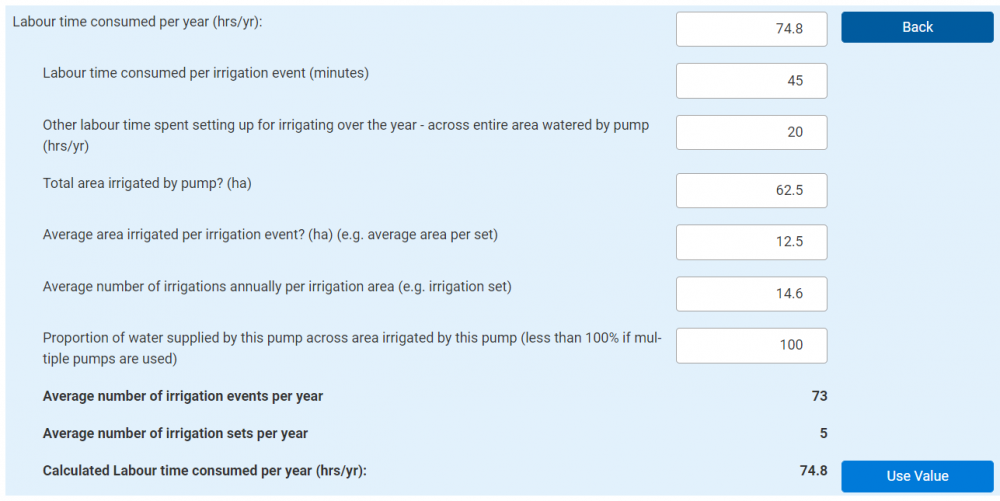
Labour Time
1. If known, enter the labour time consumed per year (hrs/yr) OR click “Calculate” to calculate the figure.
2. Some of the following figures may have already been previously entered and will appear here.
3. Enter the labour time consumed per irrigation event in minutes (minutes).
4. Enter other labour time spent setting up for irrigation over the year, across the entire area watered by the pump in hours per year (hrs/yr).
5. Enter the total area irrigated by pump in hectares (ha).
6. Enter the average area irrigated per irrigation event in hectares (ha). For example, average area per set.
7. Enter the average number of irrigations annually per irrigation area. For example, irrigation set.
8. Enter the proportion of water supplied by this pump across area irrigated by this pump as a percentage (%).
- This would be less than 100% if multiple pumps are used.
9. Displayed for your information will be the average number of irrigation events per year and the average number of irrigation sets per year.
10. The calculated labour time consumed per year in (hrs/yr) can be used by clicking “Use Value”.
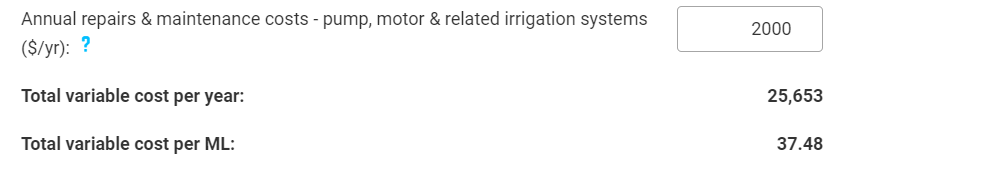
Repairs and Maintenance
1. Enter the annual repairs and maintenance costs in dollars per year ($/yr).
- Repairs and maintenance costs include rewiring electric motors or servicing diesel motors; replacing nozzles, hoses, pipes, connections, filters, rollers, valves, tyres and maintaining gearboxes for centre pivot, lateral move and winch systems along with replacing tape for drip systems and replacing fluming and cups for furrow systems.
- Costs for labour, lubricants and cleaning agents that are used for R & M should also be included here.
2. Displayed for your information will be the total variable cost per year ($/yr) and the total variable cost per ML ($/ML).
Furrow System
Repairs and maintenance costs for furrow systems often include the following:
- Replacing fluming and cups.
- Repacking pumps.
- Rewiring motors.
Winch/Travelling Gun System
Repairs and maintenance costs for winch/travelling gun systems often include the following:
- Maintaining gearboxes.
- Replacing soft hoses.
- Repairing connections.
Centre Pivot System
Repairs and maintenance costs for centre pivot systems often include the following:
- Maintaining gearboxes.
Lateral Move System
Repairs and maintenance costs for lateral move systems often include the following:
- Maintaining gearboxes.
Boom System
Repairs and maintenance costs for boom systems often include the following:
- Replacing nozzles, hoses, pipes, connections, filters, rollers, valves, tyres.
Drip/Trickle System
Repairs and maintenance costs for drip/trickle system often include the following:
- Water Pump and motor costs. For example, replacing pump packing and rewiring (electric) motors following burnout.
- System flushes to disinfect/remove precipitation. For example, algae and fertiliser.
- Replacement of dripperline and pipe infrastructure (including labour).
- Pest control. For example, rat baits.
- Filter maintenance.
Hand-shift Sprinkler System
Repairs and maintenance costs for hand-shift sprinkler systems often include the following:
- Replacing nozzles, hoses, pipes, connections, filters, rollers, valves, tyres.
Fixed Electricity Costs
Enter fixed electricity costs as dollars per year ($/yr).

Submitting Pumps and Having Multiple Pumps
Click “Submit” to add the pump.
- A scenario can have multiple pumps. Follow the steps above to add additional pumps.