Main Page
Welcome to the FEAT Online wiki
This wiki is for users of FEAT Online and if you are reading this content it is provided to you on the basis that you have registered for FEAT Online and accepted its terms and conditions.
This wiki is your step by step guide and user help manual, helping you get the most out of the Farm Economics Analysis Tool (FEAT) Online. You can open the wiki by selecting 'User Guide' up the top of the tool or by clicking 'Help' on the bottom left side which will bring you to the specific wiki page for the FEAT Online page you are on. This is the main page of the wiki, to get to a specific page use the table of contents and then click on the hyperlink for a heading for more information on a specific page.
Tip: We recommend having the FEAT Online website opened in a separate window while following along step by step in the wiki.
What is FEAT Online?
The FEAT Online website is a planning and decision-making tool used to assist cane farming enterprises. FEAT Online enables you to evaluate the economic impact from changing farm management practices. Other uses for FEAT Online include evaluating farm labour requirements, preparing cash flow budgets and quantifying the impact of “what if” scenarios.
Common Menu Items
Common menu items include:
- Main Navigation Bar which will always contain the same menu items.
- Contextual Navigation Bar which will display links relevant to the current page.
- Wizard Buttons at the bottom of the page will have a logical back and next button.
- The five Action buttons are Edit, Copy, Share, Archive and Delete.
For more information go to Common Menu Items.
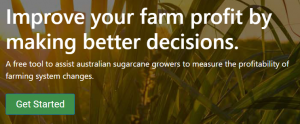
Home Page
This is the home page for the tool which explains the purpose of the tool, has many links to get started and hosts the tutorial videos.
For more information go to Home Page.
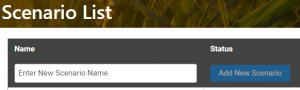
Scenario List
This page lists all the scenarios developed (and the regional scenarios) and enables you to edit, copy, archive, share and delete scenarios or compare the performance of two different scenarios. You can either add a new scenario, continue working on a previously created scenario or modify a regional scenario.
For more information go to Scenario List.
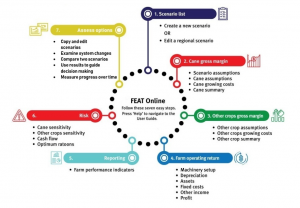
Scenario Home
This page shows a flow diagram illustrating the process involved when developing a FEAT scenario.
For more information go to Scenario Home.
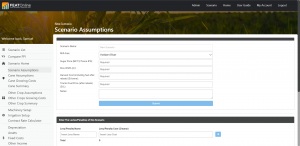
Scenario Assumptions
This page is used to calculate the cost of harvesting, cane price and net revenue. You can add in information for mill area, other assumptions and levies.
For more information go to Scenario Assumptions.
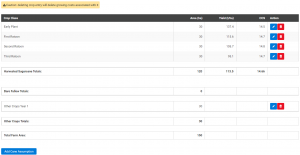
Cane Assumptions
This page is for entering cane growing area, yield and CCS for each crop class. Other Crops information for area should also be entered in, if applicable.
For more information go to Cane Assumptions.
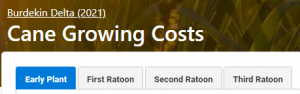
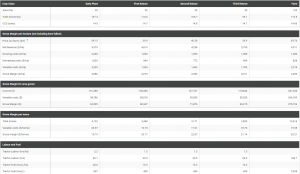
Cane Growing Costs
This page is used to calculate cane growing costs per hectare, including the costs of machinery operations, fertiliser, pesticides and irrigation.
For more information please go to Cane Growing Costs.
Cane Summary
This page is a summary of gross margin information based on information entered on the Cane Assumptions, Cane Growing Costs and Scenario Assumptions pages. This page displays all cane crop classes, a farm column and no entry of information is required.
For more information go to Cane Summary.
Other Crop Assumptions
This page enables you to calculate net revenue from growing crops other than cane on fallow blocks.
Information for area for Other Crops Year 1 and Other Crops Year 2 (if applicable) will have to be already added, on the Cane Assumptions page, to enable this page.
For more information go to Other Crop Assumptions.
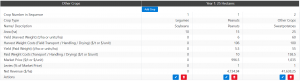
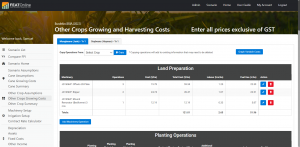
Other Crops Growing Costs
This page is used to calculate the variable costs per hectare from growing crops other than cane on fallow blocks. In addition to the sections contained in Cane Growing Costs, there are 3 additional categories, Other Crop Costs, Harvesting Costs and Packing Costs.
For more information go to Other Crops Growing Costs.
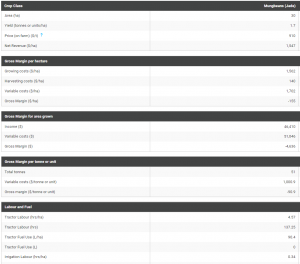
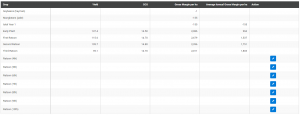
Other Crop Summary
This page is a summary of gross margin information based on information entered on the Other Crop Assumptions, Other Crops Growing Costs and Scenario Assumptions pages.
This page displays all other crops and no entry of information is required.
For more information go to Other Crop Summary.
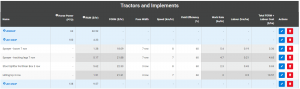
Machinery Setup
This page can be used to edit existing information for tractors and implements or to add additional information to calculate machinery costs. It is likely that most of this page is filled out already if data has been entered on the Cane Growing Costs or Other Crops Growing Costs pages.
For more information go to Machinery Setup.
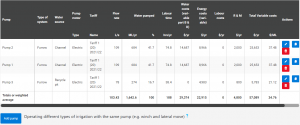
Irrigation Setup
This page is used to add irrigation pumps and associated information.
For more information go to Irrigation Setup.
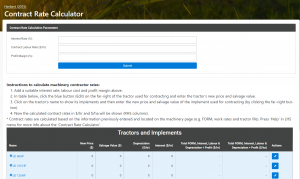
Contract Rate Calculator
This page enables you to calculate a contractor rate by factoring in depreciation and interest expenses for their tractors and implements, contract labour and profit margin – in addition to the Fuel, Oil, Repairs and Maintenance costs transferred from the Machinery Setup page.
For more information go to Contract Rate Calculator.
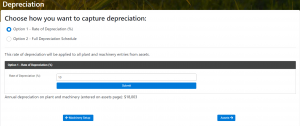
Depreciation
Depreciation is regarded as a fixed cost. Unlike other fixed costs there is no cash flow for depreciation. So why include it when calculating profit? At some point assets will wear out and need to be replaced. Including depreciation ensures that profit is sufficient to cover their eventual replacement.
For more information go to Depreciation.
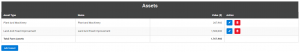
Assets
This page is used to record total farm assets. Values for Plant & Machinery can then be applied with a Depreciation rate to calculate a total Annual Depreciation figure, shown in the Fixed Costs page. Values for this and the remaining asset types (Land & Fixed Improvements, Inventories, Livestock and Other) are used in the calculations for Return on Investment (%) in the Profit page.
For more information go to Assets.
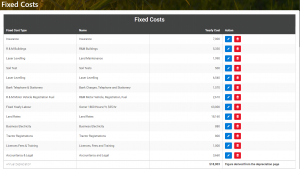
Fixed Costs
This page is used to sum all of the fixed costs, including the cost of insurance, land rates, accounting fees, and building and vehicle repairs and maintenance, and more. It is also where fixed water and electricity costs are added.
For more information go to Fixed Costs.
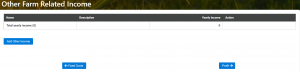
Other Income
This page is used to enter additional income that users may receive.
For more information go to Other Income.
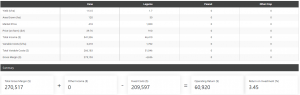
Profit
This page shows a breakdown of Area, Total Income, Total Variable Costs and Total Gross Margin for cane and any other crops entered into the scenario. Furthermore, Fixed Costs are subtracted and Other Income added to the Total Gross Margin in order to calculate the Farm Operating Return. The Return on Investment (%) is also calculated by dividing Total Assets (from Assets page) by the Operating Return.
For more information go to Profit.
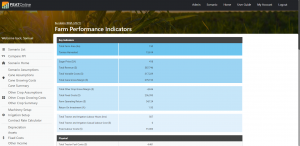
Farm Performance Indicators
This page provides users with a range of Farm Performance Indicators for the selected FEAT scenario. Users do not need to enter any information into this page.
For more information go to Farm Performance Indicators.
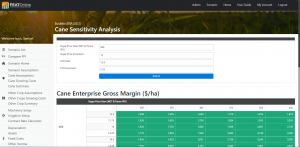
Cane Sensitivity
This page provides a cane sensitivity analysis table, which shows the cane average gross margin at different sugar prices and CCS values. Given uncertainty around the price growers will receive for their sugar and their season average CCS, sensitivity analysis is useful to explore the impact to profitability (gross margin) if the sugar price and CCS vary from what is expected.
For more information go to Cane Sensitivity.
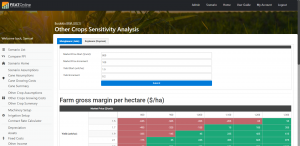
Other Crop Sensitivity
This page contains provides a sensitivity analysis table for each of the other crops entered by the user. After choosing the particular ‘Other Crop’ that users want to examine, the sensitivity table will show the average gross margin at different combinations of market prices and yield.
Given the similarities, please see the step-by-step details for Cane Sensitivity above for instructions on how to enter the starting price/yield and incremental changes.
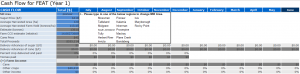
Cash Flow
This page enables users to download a Cash Flow Worksheet. When downloaded, the worksheet is pre-filled with specific information from the FEAT scenario such as revenues and expenses.
To download the Worksheet, users need to click on the ‘Download Worksheet’ button and save the file to a familiar folder on their computer.
For more information go to Cash Flow.
Optimum Ratoons
This page calculates the optimum number of ratoons grown in a crop cycle that maximises profitability. The optimum number of ratoons is identified by the last ratoon that contributes to an increased average annual gross margin per hectare over the crop cycle. Thereafter, additional ratoons will result in a decreased average gross margin, indicating the need to replant.
For more information go to Optimum Ratoons.
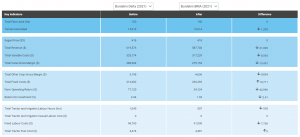
Compare FPI
This page compares the profitability of two different scenarios as well as various other key Farm Performance Indicators. For example, important measures like Gross Margin, Operating Return, Return on Investment and Casual Labour Hours are compared between two different management practice or farming system scenarios.
For more information go to Compare FPI.
More Information
If users require any further information not outlined above, please send us an email by following the instructions on Contact Us.