Difference between revisions of "Farm Performance Indicators"
| (24 intermediate revisions by the same user not shown) | |||
| Line 1: | Line 1: | ||
This page provides you with a range of Farm Performance Indicators for the selected FEAT scenario. You do not need to enter any information into this page. Each Farm Performance Indicator is listed below together with a short definition. | |||
This page provides | |||
* '''Note:''' If you wish to view the Farm Performance Indicators for two different scenarios as a comparison please visit the [[Compare FPI]] page. | |||
===Key Indicators=== | |||
'''These include important measures like Gross Margin, Operating Return, Return on Investment and Casual Labour Hours.''' | |||
* '''Total Farming Area (ha)''': identifying whole of farm area. This may include land that is used to grow other crops in rotation with the sugarcane enterprise. | * '''Total Farming Area (ha)''': identifying whole of farm area. This may include land that is used to grow other crops in rotation with the sugarcane enterprise. | ||
* '''Tonnes Harvested''': Total tonnes of cane harvested across the whole farm. | * '''Tonnes Harvested''': Total tonnes of cane harvested across the whole farm. | ||
| Line 13: | Line 16: | ||
* '''Return On Investment - whole enterprise (%)''': measures the economic return achieved relative to the value of all the farm’s resources. The figure indicates whole of farm profitability, however it does not include financing costs or taxes. | * '''Return On Investment - whole enterprise (%)''': measures the economic return achieved relative to the value of all the farm’s resources. The figure indicates whole of farm profitability, however it does not include financing costs or taxes. | ||
* '''Casual Labour Hours (hrs/yr)''': calculated by summing both machinery and irrigation labour hours across the whole farm. Casual Labour Hours are important when comparing two scenarios with different management practices that influence labour requirements (different row spacing or irrigation systems), particularly when variable labour has not been allocated costs (e.g. $35/hr). | * '''Casual Labour Hours (hrs/yr)''': calculated by summing both machinery and irrigation labour hours across the whole farm. Casual Labour Hours are important when comparing two scenarios with different management practices that influence labour requirements (different row spacing or irrigation systems), particularly when variable labour has not been allocated costs (e.g. $35/hr). | ||
* '''Casual Labour Cost ($/yr)''': calculated by summing both machinery and irrigation labour costs across the whole farm. This will be zero if | * '''Casual Labour Cost ($/yr)''': calculated by summing both machinery and irrigation labour costs across the whole farm. This will be zero if you have not added a casual labour cost into the [[Machinery Setup]] page and the [[Cane Growing Costs]] and [[Other Crops Growing Costs]] pages (within the irrigation sections). Casual Labour Costs are important when comparing two scenarios with different management practices that influence labour requirements (different row spacing or irrigation systems) if variable labour has been allocated costs (e.g. $35/hr). | ||
* '''Permanent (Fixed) Labour Costs ($)''': transferred from the | * '''Permanent (Fixed) Labour Costs ($)''': transferred from the [[Fixed Costs]] page. Vital when comparing the performance of two different farming systems. | ||
[[File:Key Indicators cropped.png|frameless|center|link=]] | |||
===Physical=== | |||
'''These include indicators for area, yield, CCS and more.''' | |||
* '''Total farming area (ha)''': already defined above. | * '''Total farming area (ha)''': already defined above. | ||
* '''Cane harvested area (ha)''': area of sugarcane harvested. | * '''Cane harvested area (ha)''': area of sugarcane harvested. | ||
| Line 24: | Line 32: | ||
* '''Rotational crops area (ha)''': area of crops grown in rotation with a sugarcane crop production system (eg. Legumes). | * '''Rotational crops area (ha)''': area of crops grown in rotation with a sugarcane crop production system (eg. Legumes). | ||
[[File:Compare FPI Physical.png|1000px|frameless|center|link=]] | |||
===Resources=== | |||
'''These include indicators for machinery investment, tractor cost in litres and dollars, irrigation, and more.''' | |||
* '''Land and fixed improvements ($/ha)''': estimated market value of the whole farm expressed on a per hectare basis. The calculation includes land and fixed improvements (eg. sheds, water mains and dams) and influences the return on investment calculation. | * '''Land and fixed improvements ($/ha)''': estimated market value of the whole farm expressed on a per hectare basis. The calculation includes land and fixed improvements (eg. sheds, water mains and dams) and influences the return on investment calculation. | ||
* '''Machinery Investment ($/ha)''': a guide to whether the whole of farm business is over or under capitalized. Includes all machinery and equipment used to run the farming business. This measure should only be compared with values for farms of the same type and size. This figure can also influence the return on investment calculation. | * '''Machinery Investment ($/ha)''': a guide to whether the whole of farm business is over or under capitalized. Includes all machinery and equipment used to run the farming business. This measure should only be compared with values for farms of the same type and size. This figure can also influence the return on investment calculation. | ||
| Line 32: | Line 45: | ||
* '''Sugarcane irrigation efficiency (tonnes/ML applied)''': tonnes of cane per ML irrigation water applied. This PI will be most meaningful when comparing farms in a geographic location with similar soil types and receiving a similar amount of rainfall (both annual total and distribution). | * '''Sugarcane irrigation efficiency (tonnes/ML applied)''': tonnes of cane per ML irrigation water applied. This PI will be most meaningful when comparing farms in a geographic location with similar soil types and receiving a similar amount of rainfall (both annual total and distribution). | ||
[[File:Compare FPI Resources.png|1000px|frameless|center|link=]] | |||
===Profitability=== | |||
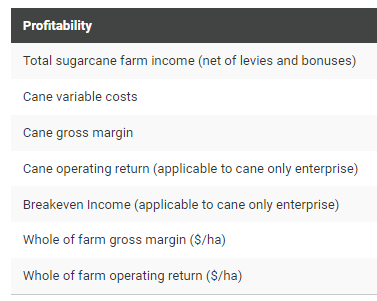
'''These include indicators using a dollar per hectare ($/ha) and a dollar per tonne ($/tonne) measure, for cane farm income, cane variable costs, cane breakeven income and more.''' | |||
* '''Total sugarcane farm income, net of levies and bonuses ($/ha and $/tonne)''': income derived by the sugarcane enterprise relative to its size in hectares and tonnes. Already defined above. | * '''Total sugarcane farm income, net of levies and bonuses ($/ha and $/tonne)''': income derived by the sugarcane enterprise relative to its size in hectares and tonnes. Already defined above. | ||
* '''Cane variable costs ($/ha and $/tonne)''': costs associated with growing cane that are directly related to the level of output from the business (e.g. harvesting, chemicals, fertiliser, fuel, oil repairs, contractors, etc.). The amount spent is under the control of the manager and can be changed quickly in the short term. A high figure may indicate that the business needs to review its farming system practices or it may have a high proportion of contracted operations, leased land or casual labour. | * '''Cane variable costs ($/ha and $/tonne)''': costs associated with growing cane that are directly related to the level of output from the business (e.g. harvesting, chemicals, fertiliser, fuel, oil repairs, contractors, etc.). The amount spent is under the control of the manager and can be changed quickly in the short term. A high figure may indicate that the business needs to review its farming system practices or it may have a high proportion of contracted operations, leased land or casual labour. | ||
| Line 39: | Line 57: | ||
* '''Whole of farm gross margin ($/ha)''': the summation of gross margins for all cropping enterprises. | * '''Whole of farm gross margin ($/ha)''': the summation of gross margins for all cropping enterprises. | ||
* '''Whole of farm operating return ($/ha)''': As defined above but on a per hectare basis. | * '''Whole of farm operating return ($/ha)''': As defined above but on a per hectare basis. | ||
[[File:Compare FPI Profitability.png|1000px|frameless|center|link=]] | |||
===Cost Ratios=== | |||
'''These include indicators for return on investment, fixed costs compared to farm income, average growing costs, and more.''' | |||
* '''Fixed costs ($/ha)''': whole of farm fixed cost expressed on a per hectare basis. The expectation would be that the greater the size of the farm the lower the fixed costs per hectare. | * '''Fixed costs ($/ha)''': whole of farm fixed cost expressed on a per hectare basis. The expectation would be that the greater the size of the farm the lower the fixed costs per hectare. | ||
* '''Total fixed costs/Total farm income''': indicates what proportion of total farm income went towards the payment of whole of farm fixed costs. Lower figures may be attributed to economies of scale, a more efficient farming system which requires less machinery or a high income. This figure will be influenced by price fluctuations, therefore it is difficult to benchmark over time. | * '''Total fixed costs/Total farm income''': indicates what proportion of total farm income went towards the payment of whole of farm fixed costs. Lower figures may be attributed to economies of scale, a more efficient farming system which requires less machinery or a high income. This figure will be influenced by price fluctuations, therefore it is difficult to benchmark over time. | ||
| Line 47: | Line 71: | ||
* '''Average land preparation costs for plant cane ($/ha)''': the cost of land preparation prior to planting sugarcane. A high figure may indicate excessive tillage before planting or contracted tillage operations causing higher variable costs. | * '''Average land preparation costs for plant cane ($/ha)''': the cost of land preparation prior to planting sugarcane. A high figure may indicate excessive tillage before planting or contracted tillage operations causing higher variable costs. | ||
* '''Sugarcane fertiliser and soil ameliorants cost ($/ha)''': the average cost of fertiliser and soil ameliorants (e.g. lime, gypsum) for plant, ratoon and fallow areas. | * '''Sugarcane fertiliser and soil ameliorants cost ($/ha)''': the average cost of fertiliser and soil ameliorants (e.g. lime, gypsum) for plant, ratoon and fallow areas. | ||
[[File:Compare FPI Cost Ratios.png|1000px|frameless|center|link=]] | |||
[[Profit]] ⇐|⇒ [[Cane Sensitivity]] | |||
Latest revision as of 00:06, 29 June 2023
This page provides you with a range of Farm Performance Indicators for the selected FEAT scenario. You do not need to enter any information into this page. Each Farm Performance Indicator is listed below together with a short definition.
- Note: If you wish to view the Farm Performance Indicators for two different scenarios as a comparison please visit the Compare FPI page.
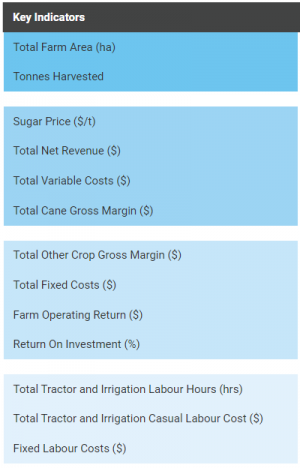
Key Indicators
These include important measures like Gross Margin, Operating Return, Return on Investment and Casual Labour Hours.
- Total Farming Area (ha): identifying whole of farm area. This may include land that is used to grow other crops in rotation with the sugarcane enterprise.
- Tonnes Harvested: Total tonnes of cane harvested across the whole farm.
- Sugar Price ($/t): Average sugar price received per tonne of sugar.
- Total Income/Revenue ($): income derived from both sugarcane and other crops. The calculated figure is directly influenced by crop prices, yields and crop quality (e.g. CCS for sugarcane). This does not take into account production costs and therefore does not measure profit.
- Total Variable Costs ($): costs associated with growing cane and other crops that are directly related to the level of output from the business (eg. harvesting, chemicals, fertilizer, fuel, oil repairs, contractors etc). The amount spent is under the control of the manager and can be changed quickly in the short term. A high figure may indicate that the business needs to review its farming system practices or it may have a high proportion of contracted operations, leased land or casual labour.
- Total Cane Gross Margin ($): the difference between total income and total variable costs for the sugarcane enterprise. Cane gross margin is the sugarcane enterprise’s contribution to fixed costs and profits after the variable costs have been paid. This figure is important for maximising whole of farm profit in the short run as fixed costs are difficult to change.
- Total Other Crop gross Margin ($): the difference between total income and total variable costs for the other crops enterprise. Other crop gross margin is the other crop enterprise’s contribution to fixed costs and profits after the variable costs have been paid. This figure is important for maximising whole of farm profit in the short run as fixed costs are difficult to change.
- Farm Operating Return ($): calculated by subtracting fixed costs from the whole of farm gross margin and adding miscellaneous income.
- Return On Investment - whole enterprise (%): measures the economic return achieved relative to the value of all the farm’s resources. The figure indicates whole of farm profitability, however it does not include financing costs or taxes.
- Casual Labour Hours (hrs/yr): calculated by summing both machinery and irrigation labour hours across the whole farm. Casual Labour Hours are important when comparing two scenarios with different management practices that influence labour requirements (different row spacing or irrigation systems), particularly when variable labour has not been allocated costs (e.g. $35/hr).
- Casual Labour Cost ($/yr): calculated by summing both machinery and irrigation labour costs across the whole farm. This will be zero if you have not added a casual labour cost into the Machinery Setup page and the Cane Growing Costs and Other Crops Growing Costs pages (within the irrigation sections). Casual Labour Costs are important when comparing two scenarios with different management practices that influence labour requirements (different row spacing or irrigation systems) if variable labour has been allocated costs (e.g. $35/hr).
- Permanent (Fixed) Labour Costs ($): transferred from the Fixed Costs page. Vital when comparing the performance of two different farming systems.
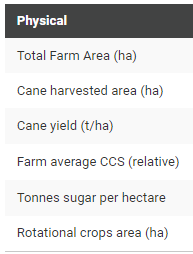
Physical
These include indicators for area, yield, CCS and more.
- Total farming area (ha): already defined above.
- Cane harvested area (ha): area of sugarcane harvested.
- Cane yield (t/ha): average tonnes of sugarcane per hectare for all crop classes.
- Farm average CCS (relative): average relative sugar concentration for the entire sugarcane crop.
- Tonnes sugar per hectare: determined by the yield and CCS levels of the sugarcane crop and indicates the amount of sugar produced per hectare. Provides an overall indication of the enterprise production output.
- Rotational crops area (ha): area of crops grown in rotation with a sugarcane crop production system (eg. Legumes).
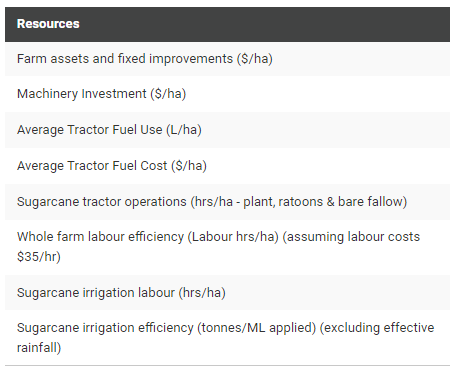
Resources
These include indicators for machinery investment, tractor cost in litres and dollars, irrigation, and more.
- Land and fixed improvements ($/ha): estimated market value of the whole farm expressed on a per hectare basis. The calculation includes land and fixed improvements (eg. sheds, water mains and dams) and influences the return on investment calculation.
- Machinery Investment ($/ha): a guide to whether the whole of farm business is over or under capitalized. Includes all machinery and equipment used to run the farming business. This measure should only be compared with values for farms of the same type and size. This figure can also influence the return on investment calculation.
- Sugarcane tractor operations (hrs/ha - plant, ratoons & bare fallow): provides an indication of the farming system efficiency by calculating the amount of time spent undertaking tractor operations in the plant, ratoon and bare fallow areas of a sugarcane crop.
- Whole farm casual labour efficiency (labour hrs/ha): measures the effectiveness of the manager to use labour resources to operate the business. Businesses must have similar characteristics to allow for a comparison. For example, mixed enterprises will generally have a higher labour input per hectare because of the labour required to grow another crop.
- Sugarcane irrigation casual labour (hrs/ha): measures the effectiveness of the manager to use labour resources to irrigate the sugarcane crop. The calculated figure may be influenced by irrigation practices, irrigation system, environmental conditions or the availability of water.
- Sugarcane irrigation efficiency (tonnes/ML applied): tonnes of cane per ML irrigation water applied. This PI will be most meaningful when comparing farms in a geographic location with similar soil types and receiving a similar amount of rainfall (both annual total and distribution).
Profitability
These include indicators using a dollar per hectare ($/ha) and a dollar per tonne ($/tonne) measure, for cane farm income, cane variable costs, cane breakeven income and more.
- Total sugarcane farm income, net of levies and bonuses ($/ha and $/tonne): income derived by the sugarcane enterprise relative to its size in hectares and tonnes. Already defined above.
- Cane variable costs ($/ha and $/tonne): costs associated with growing cane that are directly related to the level of output from the business (e.g. harvesting, chemicals, fertiliser, fuel, oil repairs, contractors, etc.). The amount spent is under the control of the manager and can be changed quickly in the short term. A high figure may indicate that the business needs to review its farming system practices or it may have a high proportion of contracted operations, leased land or casual labour.
- Cane gross margin ($/ha and $/tonne): already defined above.
- Cane operating return ($/ha and $/tonne - if 100% cane only): calculated by subtracting the whole of farm fixed costs from the cane enterprise gross margin. This figure is not applicable to mixed enterprises as fixed costs may not be solely attributed to the sugarcane enterprise.
- Whole of farm gross margin ($/ha): the summation of gross margins for all cropping enterprises.
- Whole of farm operating return ($/ha): As defined above but on a per hectare basis.
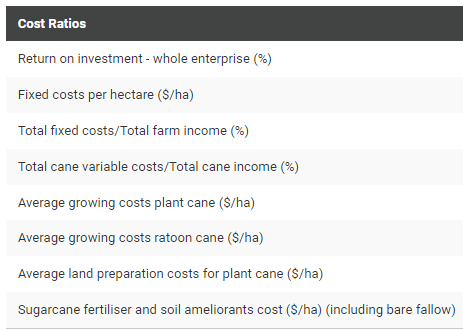
Cost Ratios
These include indicators for return on investment, fixed costs compared to farm income, average growing costs, and more.
- Fixed costs ($/ha): whole of farm fixed cost expressed on a per hectare basis. The expectation would be that the greater the size of the farm the lower the fixed costs per hectare.
- Total fixed costs/Total farm income: indicates what proportion of total farm income went towards the payment of whole of farm fixed costs. Lower figures may be attributed to economies of scale, a more efficient farming system which requires less machinery or a high income. This figure will be influenced by price fluctuations, therefore it is difficult to benchmark over time.
- Total cane variable costs/Total cane income: indicates the proportion of total sugarcane enterprise income that went towards the payment of sugarcane variable costs. A high figure may indicate that the business needs to review its farming system practices or it may have a high proportion of contracted operations, leased land or casual labour. This figure will be influenced by price fluctuations, therefore it is difficult to benchmark over time.
- Average growing expenses plant cane ($/ha): the average land preparation, planting, fertilizer, weed control, insect control, disease control and irrigation costs for growing a crop of plant cane. The average includes spring plant, autumn plant and plough-out replant. The calculation only considers the crop class on the farm i.e. if there is no autumn crop it is not part of the average.
- Average growing expenses ratoon cane ($/ha): the average cultivation, fertilizer, weed control, insect control, disease control and irrigation costs for growing a crop of ratoon cane. The average includes all ratoon crop classes.
- Average land preparation costs for plant cane ($/ha): the cost of land preparation prior to planting sugarcane. A high figure may indicate excessive tillage before planting or contracted tillage operations causing higher variable costs.
- Sugarcane fertiliser and soil ameliorants cost ($/ha): the average cost of fertiliser and soil ameliorants (e.g. lime, gypsum) for plant, ratoon and fallow areas.