Cane Sensitivity
What is this page?
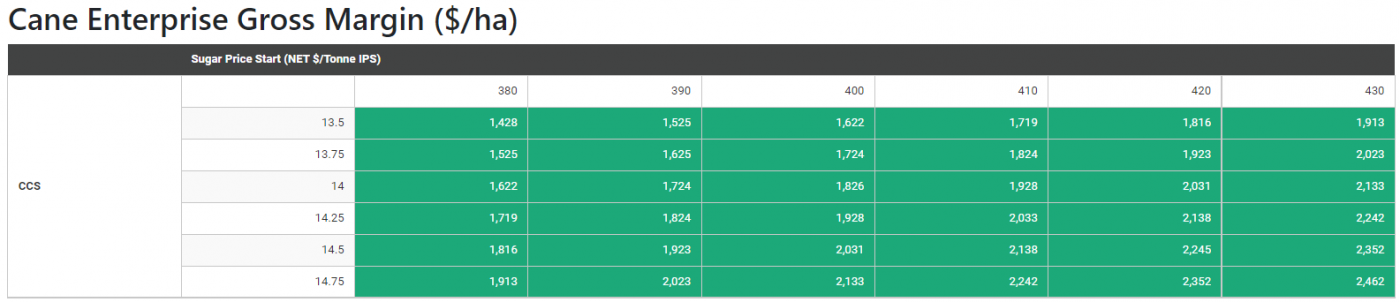
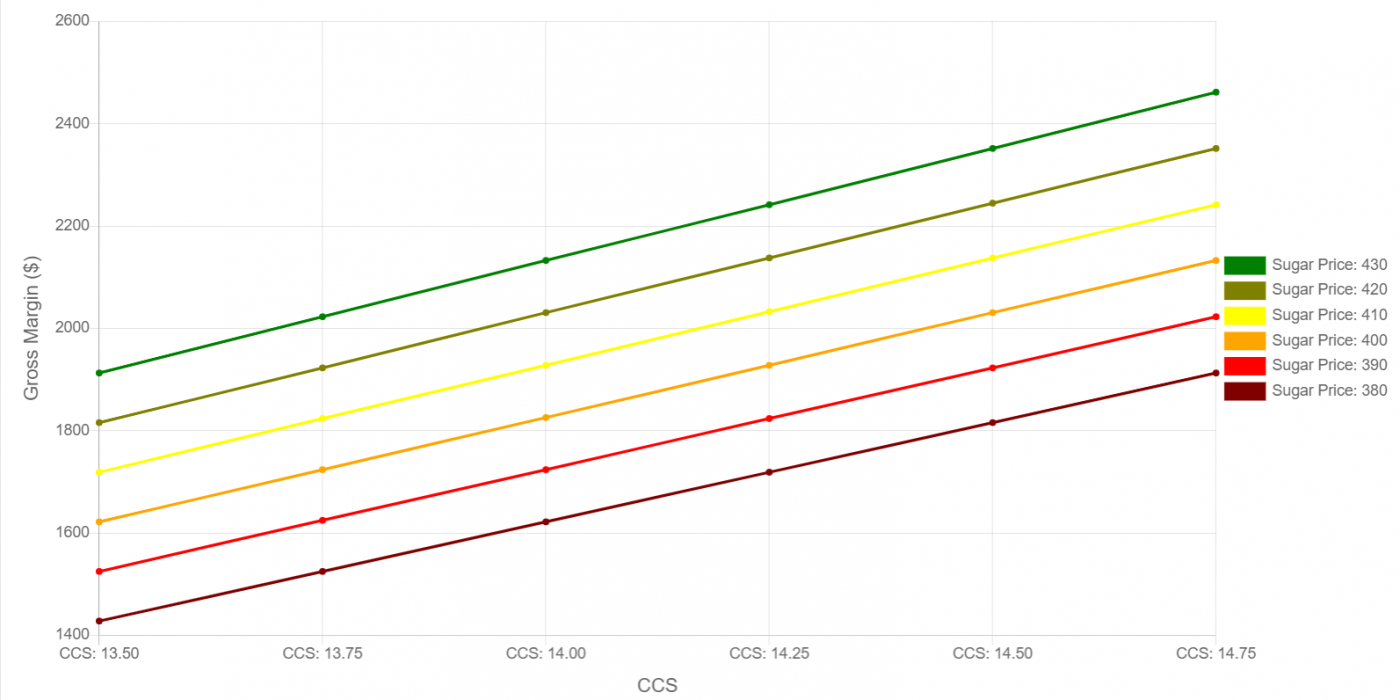
This page provides a cane sensitivity analysis table, which shows the cane average gross margin at different sugar prices and CCS values.
Why is sensitivity analysis important?
Given uncertainty around the price growers will receive for their sugar and their season average CCS, sensitivity analysis is useful to explore the impact to profitability (gross margin) if the sugar price and CCS vary from what is expected.
How to generate a cane sensitivity analysis
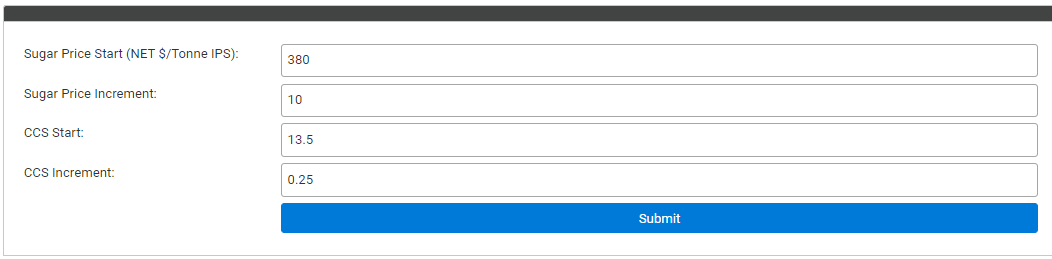
1. Enter the starting sugar price, which should be the lowest sugar price growers might expect to receive. For example, $380/tonne.
2. Enter the incremental change in sugar price, which is the dollar change per column moving to the right of the table. For example, if you enter $10 then the sugar price in each column to the right will increase by $10 each column ($380, $390, $400, etc.).
3. Enter the starting CCS value, which should be the lowest season average CCS growers expect. For example, 13.5.
4. Enter the incremental change in CCS, which is the CCS change per row in the table moving downwards. For example, if you enter 0.25 then the CCS in each row moving downwards will increase by 0.25 each row (13.5, 13.75, 14, etc.).
5. Click the "Submit" button.
Interpreting the results
After entering those four values and pressing "Submit", you can then examine the cane sensitivity table to determine the average gross margin at different combinations of sugar price and CCS.
- For example, the worst case would be the gross margin that corresponds to the lowest sugar price and CCS combination (top-left value), while the best case would be the gross margin that corresponds to the highest sugar price and CCS (bottom-right value).
- Note: The cane sensitivity analysis does not include fixed costs and therefore is not showing the true cost of production.