Uncategorised files
Jump to navigation
Jump to search
Showing below up to 50 results in range #1 to #50.
View (previous 50 | next 50) (20 | 50 | 100 | 250 | 500)
 Action icons.png 238 × 40; 2 KB
 Actions.png 247 × 124; 3 KB
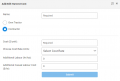
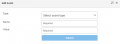 Add Asset.png 642 × 236; 10 KB
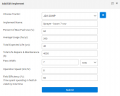
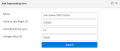 Add Depreciating Items.png 643 × 272; 16 KB
 Add Edit Crop SPot.png 633 × 477; 28 KB
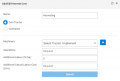 Add Harvesting.png 644 × 434; 24 KB
 Add Harvesting Contractor.png 641 × 434; 24 KB
 Add Implement.png 642 × 516; 35 KB
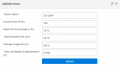 Add Tractor.png 646 × 364; 21 KB
 Add fixed cost.png 644 × 242; 11 KB
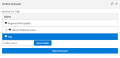
 Add new scenario.png 548 × 78; 5 KB
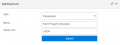
 Add other income.png 657 × 274; 11 KB
 Adding Cane Assumption.png 733 × 319; 17 KB
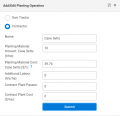
 Adding Machinery Operation.png 737 × 341; 18 KB
 Adding New Chemical.png 831 × 546; 26 KB
 Adding Planting.png 553 × 536; 33 KB
 Adding a Tariff.png 1,187 × 376; 42 KB
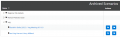 Archived Scenarios.png 917 × 282; 19 KB
 Archiving.png 645 × 314; 14 KB
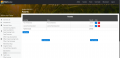 Assets.png 1,919 × 931; 480 KB
 Assets 2.png 1,585 × 276; 22 KB
 Average Pump Flow Rate.png 1,396 × 536; 71 KB
 Average kWh Charges.png 989 × 415; 49 KB
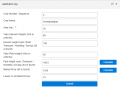
 Blank Add Pump.png 831 × 727; 65 KB
 Cane Assumptions.png 1,921 × 936; 481 KB
 Cane Assumptions 2.png 1,535 × 795; 481 KB
 Cane Growing Costs.png 1,921 × 930; 523 KB
 Cane Growing Costs Tabs.png 459 × 144; 57 KB
 Cane Growing Costs top header.png 1,390 × 131; 17 KB
 Cane Sensitivity.png 1,916 × 937; 518 KB
 Cane Sensitivity Graph.png 1,593 × 796; 125 KB
 Cane Sensitivity Input.png 1,052 × 259; 12 KB
 Cane Sensitivity Table.png 1,585 × 342; 41 KB
 Cane Summary.png 1,919 × 934; 530 KB
 Cane Summary 2.png 1,574 × 915; 100 KB
 Cash Flow.png 1,918 × 935; 404 KB
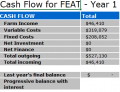 Cash Flow - Summary.png 342 × 261; 12 KB
 Cash Flow - Total.png 1,456 × 255; 26 KB
 Cash Flow - Variable and Fixed Costs.png 1,450 × 643; 74 KB
 Cash Flow - farm income.png 1,454 × 360; 45 KB
 Cash flow balance.png 1,518 × 254; 30 KB
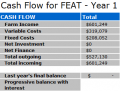 Cash flow summary.png 343 × 259; 12 KB
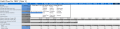 Cash flow top.png 1,516 × 371; 51 KB
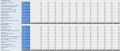 Cash flow variable and fixed costs.png 1,515 × 642; 75 KB
 Casual Labour Rate.png 805 × 123; 6 KB
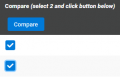 Compare Button.png 268 × 172; 6 KB
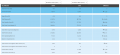 Compare FPI.png 1,414 × 647; 72 KB
 Compare FPI Cost Ratios.png 463 × 331; 30 KB
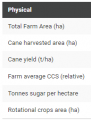 Compare FPI Physical.png 193 × 254; 13 KB
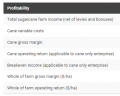 Compare FPI Profitability.png 377 × 301; 22 KB


