Scenario List
This page lists all the scenarios developed (and the regional scenarios) and enables you to edit, copy, share and delete scenarios or compare the performance of two different scenarios. You can either add a new scenario, continue working on a previously created scenario or modify a regional scenario.
Main Scenario List
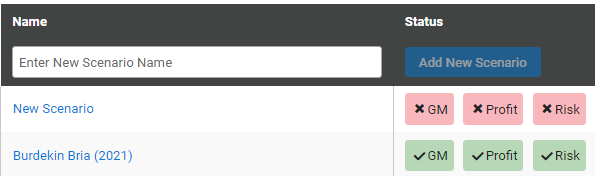
Name
The Name column lists all of the scenarios that have been developed as well as the regional scenarios (that you can copy and modify).
Create a new scenario by typing into the box that says "Enter New Scenario Name" and then clicking the "Add New Scenario Button" (in the status column).
- You can open and make changes to any of the listed scenarios by clicking on the hyperlink in blue for each scenario’s name.

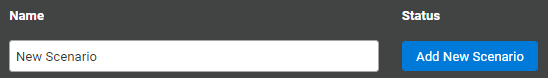

Status
The Status column indicates how much of each scenario has been completed using a colour and tick system.
GM represents the gross margin stage (income minus variable costs) and if coloured green and ticked this indicates that all information up to the Cane Summary page has been entered (including the Scenario Assumptions, Cane Assumptions and Cane Growing Costs pages).
- If the "GM" is red with a cross then some information still needs to be entered.
- Gross Margins can be used to compare profitability between two scenarios when fixed costs and capital expenditures are exactly the same.
Four more pages need information entered before you get to the Profit page (Assets, Depreciation, Fixed Costs and Other Income pages).
- If Profit is green and ticked then all information up to the Profit page has been entered, which enables you to view key measures of profitability like Farm Operating Return and Return on Investment as well as other measures on the Farm Performance Indicators page.
- Farm Operating Return can be used to compare profitability between two scenarios when fixed costs are different between scenarios, while Return on Investment goes a step further and enables comparison when total assets are different.
Entering the required information into the Cane Sensitivity and Optimum Ratoons pages will show the Risk stage as being completed (green and ticked).
- These pages provide you with useful information around: (1) the sensitivity of gross margins to different sugar prices and average CCS than expected, and; (2) the optimum number of ratoons grown to maximise profitability.
- There is also an Other Crop Sensitivity page if you have other crops in your scenario and it has similarities with the cane page.
Actions
The five "Action" buttons are Edit, Copy, Share, Archive and Delete:
1. Edit (pen icon): Enables growers to change the name of a scenario.
2. Copy (sheets of paper icon): Copies the selected scenario so you can change the name of the scenario and modify the information.
3. Share (molecule or three dots icon): Shares the scenario with another user of FEAT Online. When edits are made by the other user to the shared scenario, the changes do not affect your original scenario file.
4. Archive (folder icon): Moves the selected scenario to the Archived Scenarios list. It can be added to the main list or a certain Archived Folder that you can create.
5. Delete (garbage can icon): Deletes the entire scenario. You will need to take care not to accidently delete scenarios when using this function.
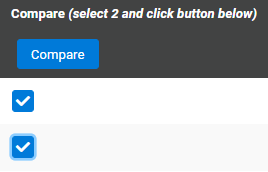
Compare
This function compares the profitability of two different scenarios as well as various other key Farm Performance Indicators.
- For example, important measures like Gross Margin, Operating Return, Return on Investment and Casual Labour Hours are compared between two different management practice or farming system scenarios.
- Compare scenarios by checking the boxes of two scenarios and clicking the "Compare" button. Alternatively, click the "Compare" button on the far left hand side column. This will take you to the Compare FPI page.
Regional Examples
1. There are regional example files for the Burdekin BRIA, Burdekin Delta, Bundaberg, Mackay, Herbert and Tully.
2. To copy a regional example file into your Main Scenario List, click the "copy" icon.
It is important to note that the parameters used (operations, input costs, yields, etc.) are examples only, are not intended to provide average or median values for each region and are not reflective of any individual situation.
To see an outline of the methods used to estimate the major parameters in the examples for all regions, see Regional Examples – Major Parameters.
For a high level of detail on the operations and products applied for each regional example, see below:
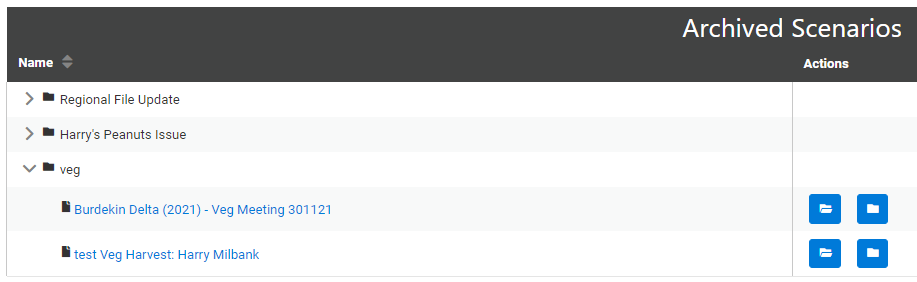
Archived Scenarios
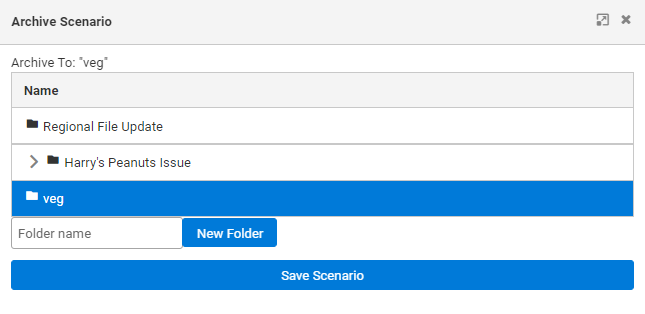
Scenarios can be archived with the following steps:
1. Click the "Archive" button to move the selected scenario to the Archived Scenarios list.
2. It can be added to the main list or a certain Archived Folder that you can create.
3. Create a new folder by typing where it says "Folder name" and then click "New Folder".
4. Select that folder and then click "Save Scenario".
Once your files are archived, you have 3 options:
1. Access the archived file directly from the "Archived Scenarios" list.
2. Unarchive the file and it will move back to the "Scenario List".
3. Re-archive the file and move it into a different folder.
- Tip: You can also rearrange the archived files from A-Z or from Z-A by clicking the toggle beside "Name".