Difference between revisions of "Compare FPI"
Jump to navigation
Jump to search

| Line 17: | Line 17: | ||
===Resource Indicators=== | ===Resource Indicators=== | ||
. | Resource indicators include comparing scenario data for machinery investment, tractor cost in litres and dollars, and irrigation. | ||
[[File:Compare FPI Resources.png|1000px|frameless|center]] | [[File:Compare FPI Resources.png|1000px|frameless|center]] | ||
===Profitability Indicators=== | ===Profitability Indicators=== | ||
Revision as of 04:19, 2 February 2022
How to get to the Compare FPI Page
Compare scenarios by checking the boxes of two scenarios and clicking the ‘Compare’ button.

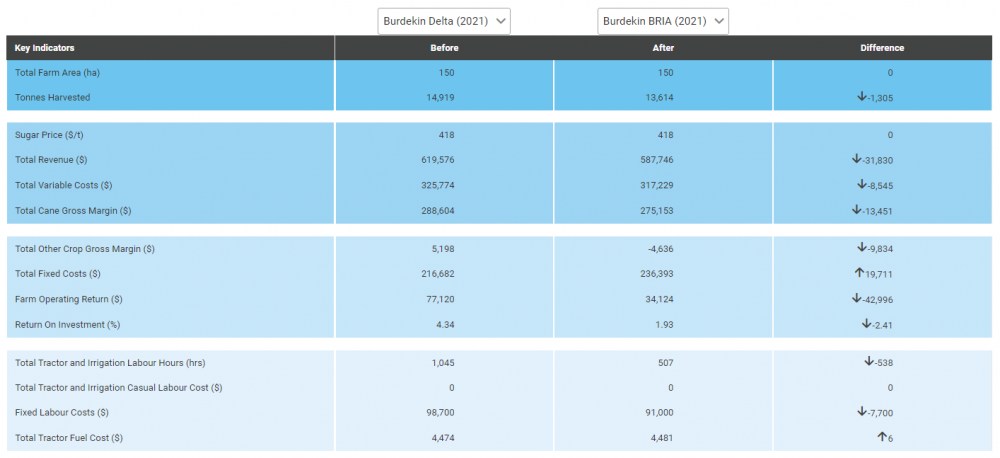
Key FPI Indicators
This function compares the profitability of two different scenarios as well as various other key Farm Performance Indicators. For example, important measures like Gross Margin, Operating Return, Return on Investment and Casual Labour Hours are compared between two different management practice or farming system scenarios.

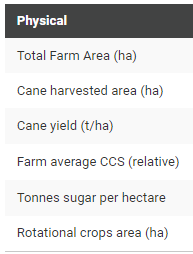
Physical Indicators
Physical Indicators include comparing scenario data for area, yield and CCS.

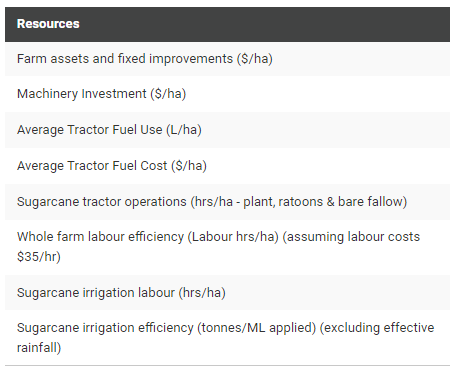
Resource Indicators
Resource indicators include comparing scenario data for machinery investment, tractor cost in litres and dollars, and irrigation.

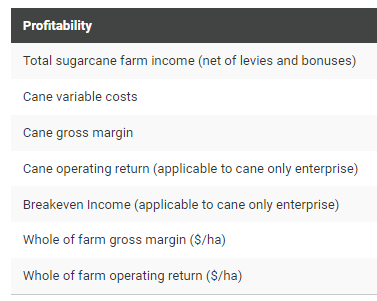
Profitability Indicators
.

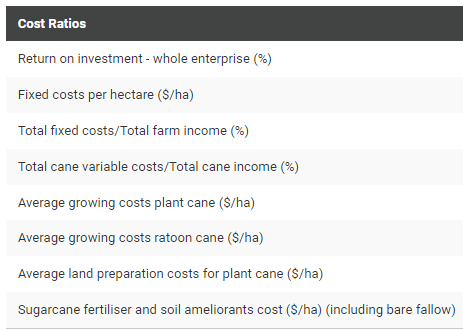
Cost Ratio Indicators
.
