Difference between revisions of "Compare FPI"
| Line 1: | Line 1: | ||
===How to get to the Compare FPI Page=== | ===How to get to the Compare FPI Page=== | ||
'''Compare scenarios by navigating to the [[Scenario List]] page, checking the boxes of two scenarios and clicking the | '''Compare scenarios by navigating to the [[Scenario List]] page, checking the boxes of two scenarios and clicking the "Compare" button.''' | ||
* Once you are on the Compare FPI page you can also change the scenarios, using the drop-down boxes up the top, that you wish to compare. | * Once you are on the Compare FPI page you can also change the scenarios, using the drop-down boxes up the top, that you wish to compare. | ||
Latest revision as of 00:17, 29 June 2023
How to get to the Compare FPI Page
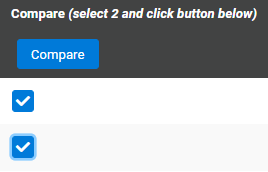
Compare scenarios by navigating to the Scenario List page, checking the boxes of two scenarios and clicking the "Compare" button.
- Once you are on the Compare FPI page you can also change the scenarios, using the drop-down boxes up the top, that you wish to compare.
If you wish to just look at one scenario, or view the definitions for each indicator, then navigate to the Farm Performance Indicators page.
Key FPI Indicators
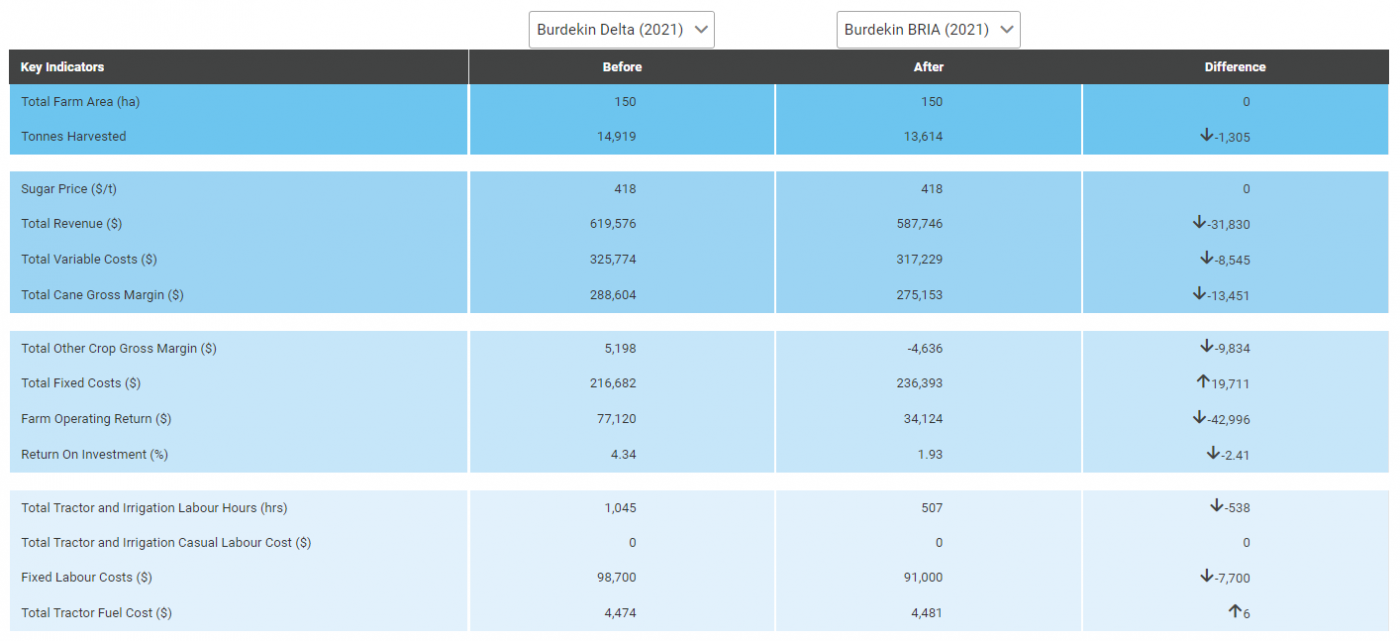
This function compares the profitability of two different scenarios as well as various other key Farm Performance Indicators.
- For example, important measures like Gross Margin, Operating Return, Return on Investment and Casual Labour Hours are compared between two different management practice or farming system scenarios.
- Make sure to put the "Before" scenario on the left hand side and the "After" scenario on the right hand side.
- Therefore, the difference (far right) column will be the "After" column subtract the "Before" Scenario.
- An increase will be shown as a positive number with an upwards arrow and a decrease will be shown as a negative number with a downwards arrow.
- Figures that are the same in both scenarios have a difference of zero.
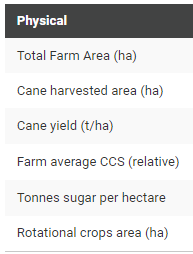
Physical Indicators
Physical indicators include comparing scenario data for area, yield, CCS and more.
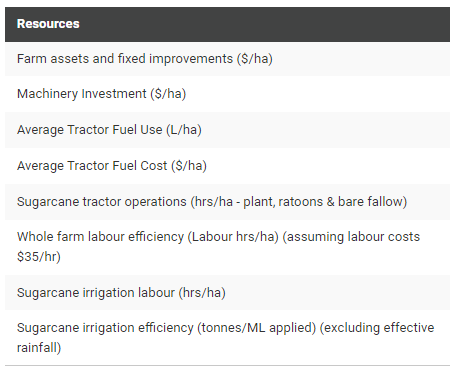
Resource Indicators
Resource indicators include comparing scenario data for machinery investment, tractor cost in litres and dollars, irrigation, and more.
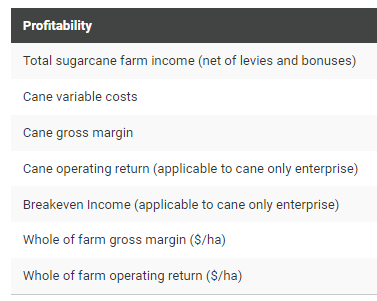
Profitability Indicators
Profitability indicators include comparing scenario data, on a dollar per hectare ($/ha) and a dollar per tonne ($/tonne) measure, for cane farm income, cane variable costs, cane breakeven income and more.
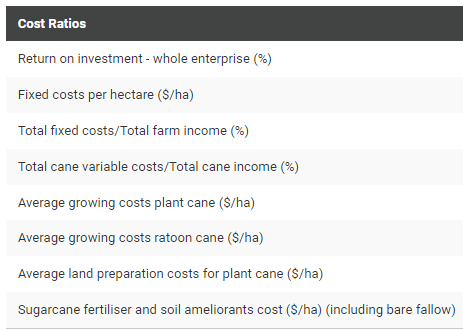
Cost Ratio Indicators
Cost ratio indicators include comparing scenario data for return on investment, fixed costs compared to farm income, average growing costs, and more.