Difference between revisions of "Optimum Ratoons"
| Line 3: | Line 3: | ||
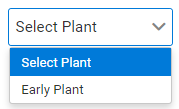
Calculate the optimum number of ratoons by selecting the cane planting time (early, late or plough-out replant) to be used for the calculation from the drop-down list. Please note that you can only select these options if you have a crop entry for them from the Cane Assumptions page. | Calculate the optimum number of ratoons by selecting the cane planting time (early, late or plough-out replant) to be used for the calculation from the drop-down list. Please note that you can only select these options if you have a crop entry for them from the Cane Assumptions page. | ||
[[File:Optimum Ratoons - Select Plant.png|1000px|frameless|center]] | [[File:Optimum Ratoons - Select Plant.png|1000px|frameless|center|link=]] | ||
| Line 12: | Line 12: | ||
[[File:Optimum ratoons.png|1000px|frameless|center]] | [[File:Optimum ratoons.png|1000px|frameless|center|link=]] | ||
[[Cash Flow]] ⇐|⇒ [[Compare FPI]] | [[Cash Flow]] ⇐|⇒ [[Compare FPI]] | ||
Revision as of 00:06, 7 February 2023
This page calculates the optimum number of ratoons grown in a crop cycle that maximises profitability. The optimum number of ratoons is identified by the last ratoon that contributes to an increased average annual gross margin per hectare over the crop cycle. Thereafter, additional ratoons will result in a decreased average gross margin, indicating the need to replant.
Calculate the optimum number of ratoons by selecting the cane planting time (early, late or plough-out replant) to be used for the calculation from the drop-down list. Please note that you can only select these options if you have a crop entry for them from the Cane Assumptions page.
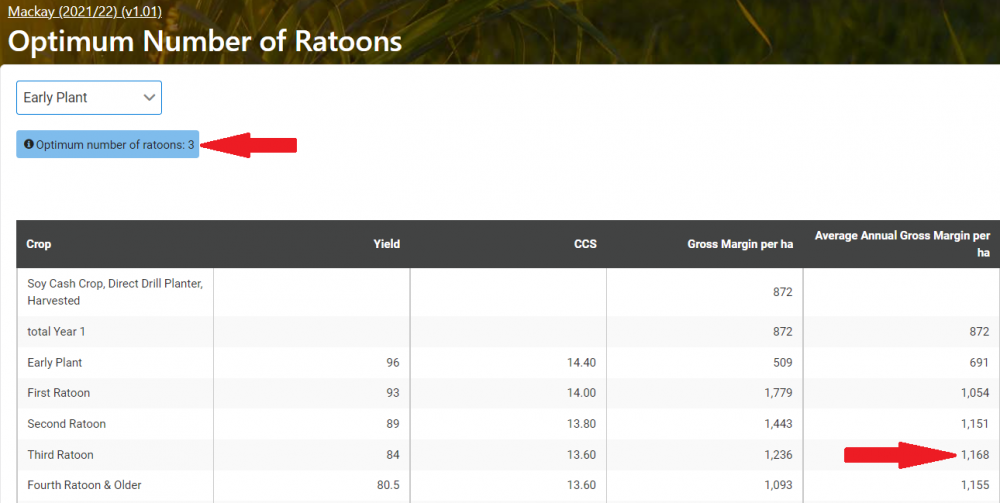
The optimum ratoons table also includes additional ratoons that have not been entered by the user (e.g. 5th to 10th ratoons). The yield and CCS values for these additional ratoons should be edited (by clicking the pencil icon) by the user by entering estimates that reflect their particular situation. The optimum number of ratoons will be shown above the table (on the left) in the light blue shaded area once the planting time has been chosen.
In the below example, the optimum number of ratoons is 3 and the average annual gross margin is $1168/ha.
Cash Flow ⇐|⇒ Compare FPI